The 7 Formats of Visual Language in the Group Graphics Keyboard
Feb 03, 2022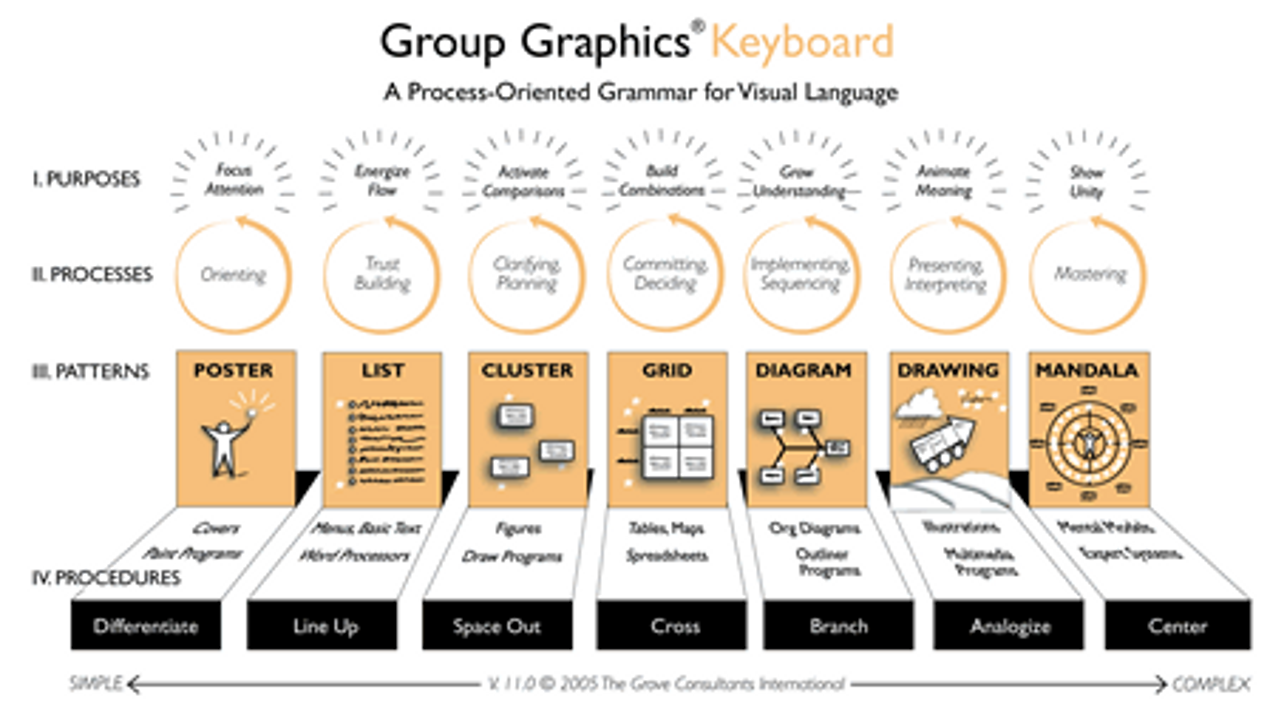
“One of the things that I love about working this way … is it destabilizes all the habituation that we have. If there’s a big chart in the room that is reflecting what everybody’s thinking, nobody really knows how to game that very effectively. I mean, you’ve got to actually listen to each other.”
David Sibbet
Recently, David Sibbet sat down with Doug Ferguson, president of Voltage Control and host of the Control the Room Podcast. The conversation touched on a number of topics from David’s beginnings as a visual facilitator and coining the term “graphic facilitator,” to the founding of The Grove Consultants International and, finally, his current work as co-director of The Grove’s Global Learning & Exchange Network (GLEN).
We’ve included an excerpt here focusing on the history, symbology and meaning of the Group Graphics® Keyboard.
Douglas Ferguson:
You mentioned the Group Graphics Keyboard, and I wanted to come back to that. Kudos to you for codifying that, and there are two things I liked about it when I first saw it. One is that it really distilled down these categories nicely, and provided the “why” behind them. Because so often, especially inexperienced facilitators will learn a tool, leaning on the structure or the methods, because they’re green, and they don’t have that clear understanding of the why. And if you don’t share the why with people, it’s really hard for them to come along with you. So articulating the why so clearly, I think that’s brilliant.
David Sibbet:
When you do a poster or a single image, all you’re trying to do is get people to focus on one thing. The way you learn to focus is you learn to differentiate what you’re looking at from everything else. And that is a mode of using your mind, just learning to focus. In drawing, how do you focus attention on something visually? Well, you have to do something that’s different from everything else.
What is listing? Listing is just flowing your attention, just moving it one thing after another, after another, after another. Just flowing with the group. So, when you’re recording a list with a group, you’re simply activating the flow of attention. It doesn’t invite making connections between those elements. It’s just like one thing after the other. That’s why it’s used for brainstorming all the time.
Now, if you shift to sticky notes that are spaced out, if you’re looking at a bunch of different objects on a wall, three or four different sticky notes, there’s no way that your brain isn’t going to start comparing those. And you will start saying, “I’m going to move this, or this should be nearer.” And it’s basically a process of activating thinking, where listing doesn’t really activate thinking. Clustering is more tapping the flow that’s activating the thinking.
The minute you put something in a matrix where you have to cross categories, you’ve got one category and the other one, and then you’re trying to figure out what fits in that cell, you’re now in an analytic process of forcing yourself to examine things out in the cells that you haven’t thought about.
Now, if you shift to diagramming, which is like a mind map or an org chart or something, where you have all the pieces and they have the connections, unlike the clusters when you have them, you are now thinking more organically as a tree grows. And these things, the process starts slow and then it grows, and grows, and grows, and grows, and there’s no end to it. You can keep branching way out into the little things.
If you take that same format—any one of those first five—and you layer on a graphic analogy, that analogy would be graphically pointing at something people already know. I’ll be on a big chart, draw an arch of a horizon, and a few little squiggles representing China, Europe, and the US. It doesn’t need much detail. And if I put a little blue in there—bang—people are looking at the earth. Why? Because they’ve seen tons of photographs of the arch of the horizon and all that kind of thing. This graphic analogy brings it to life. If I put a little road map, which is like a diagram of action over time, on top of a horizon like that, where people are thinking about the whole earth, that’s a different kind of a process than just doing a flat diagram where the content is in linked boxes.
Doug Ferguson:
Also, I love the Mandala. It’s maybe the first time I’d seen that specifically. And this notion that it’s a way of demonstrating or depicting unity. I thought that was really brilliant, too.
David Sibbet:
(Mandala) is a Sanskrit word, by the way, that means archetype. And the circle is a universal symbol of unity. So we chose that word for that particular format of everything in a circle. But in learning that, I ran into a teacher, Arthur M. Young, who was working to reconnect physics and metaphysics into one system. His insight was what makes the world unified, what connects one discipline with another, isn’t the structure and the look of it, but the way it moves, the process.
He called this a Theory of Process and I began looking at graphics as processes, not as artifacts. Later, I was asked to write an article for an educational journal and I realized that these seven formats are actually different modes of thinking. They’re different ways of working your awareness at different processes. I remembered back to Arthur talking about his system as being the yoga of thinking. Think of these different formats as different types of yogic asanas, like postures.
One of the things that I love about working this way, and I hope that it’s still unknown enough that it works this way, is it destabilizes all the habituation that we have. If there’s a big chart in the room that is reflecting what everybody’s thinking, nobody really knows how to game that very effectively. I mean, you’ve got to actually listen to each other.
Listen to the full episode of the Control the Room Podcast.
We offer graphic facilitation—the act of planning and running a meeting with visual practices. The Group Graphics Keyboard helps shape the activities and provides formats for capturing the discussions. Graphic recording, the visual note-taking of information verbalized in meetings or presentations, not only energizes engagement but provides a record for follow-through.
The Grove can support you with meeting facilitation tailored to fit your needs and your budget. The Grove’s approach to graphic facilitation provides focus, supports effective participation and incorporates big-picture visuals that allow everyone to see and understand what is happening and reach a common understanding.
Read more about our consulting services for facilitating virtual, hybrid and in-person meetings.
Learn how to use this framework in our course, Principles of Graphic Facilitation.